Engineering Software
Power Cycle Components/Processes Analysis
This section provides free Power Cycle Components/Processes Analysis.
Power Cycle Components/Processes Analysis covers the following areas:
Compression
Stoichiometric Combustion (Carbon, Hydrogen, Sulfur, Coal, Oil and Gas)
Expansion
Compression
Introduction
This section provides an isentropic compression analysis when the working fluid is air.
Analysis
In the presented compression analysis, only air is considered as the working fluid behaving as a perfect gas -- specific heat has a constant value. Ideal gas state equation is valid -- pv = RT.
Air enters a compressor at point 1 and it exits the compressor at point 2. Isentropic compression is considered with no entropy change.
Figure 1 presents a compression schematic layout.
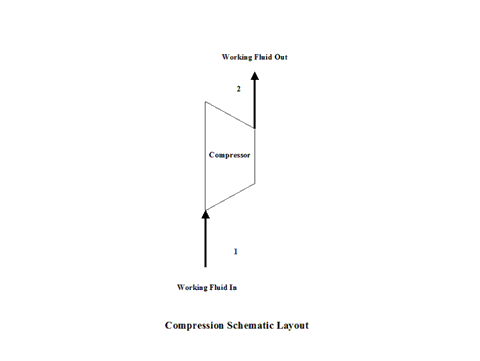
Figure 1 - Compression Schematic Layout
Figure 2 presents a compression temperature vs entropy diagram.
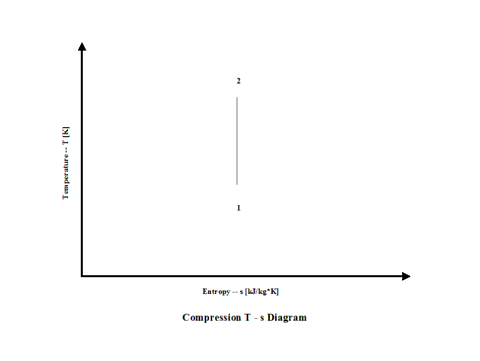
Figure 2 - Compression Temperature vs Entropy Diagram
Figure 3 presents compression specific power input requirements for a few typical compression ratio values. It should be noted that the air enters the compressor at standard ambient conditions of 298 [K] and 1 [atm] of absolute pressure.
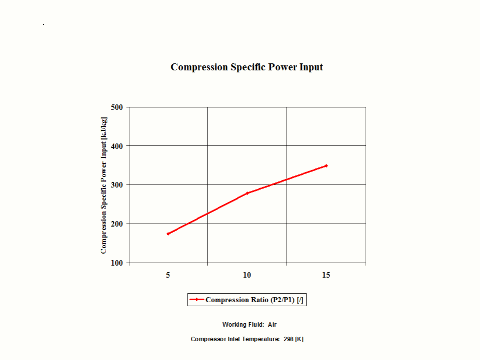
Figure 3 - Compression Specific Power Input
Figure 4 presents compression power input requirements for two typical compression ratio values and a few different working fluid mass flow rate values for a fixed compression inlet temperature.
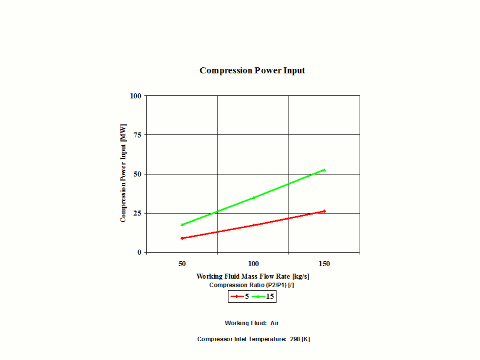
Figure 4 - Compression Power Input
One can notice that both compression specific power input and power input increase with an increase in the compression ratio values. As the working fluid mass flow rate increases for a fixed compression inlet temperature, the compression power input requirements increase too.
Assumptions
Working fluid is air. There is no friction and heat transfer. Compression is isentropic -- there is no entropy change. Ideal gas state equation is valid -- pv = RT. Air behaves as a perfect gas -- specific heat has a constant value.
Governing Equations
T2/T1 = (p2/p1)^(ϰ-1)/ϰ
ϰ = cp/cv
cp - cv = R
pv = RT
w = cp(T2 - T1)
W = cp(T2 - T1)m
Input Data
T1 = 298 [K]
p1 = 1 [atm]
p2 = 5, 10 and 15 [atm]
R = 0.2867 [kJ/kg*K]
cp = 1.004 [kJ/kg*K]
ϰ = 1.4 [/]
m = 50, 100 and 150 [kg/s]
Results
Specific Power Input vs Compression Ratio
Compression Inlet Temperature = 298 [K]
Compression
Ratio
[/]
5
10
15
Specific Power
Input
[kW/kg/s]
174
278
349
Power Input vs Compression Ratio for a few Mass Flow Rates
Compression Inlet Temperature = 298 [K]
Power Input
[MW]
Compression Ratio
[/]
5
15
Mass Flow Rate
[kg/s]
50
8.7
17.5
100
17.4
34.9
150
26.0
52.4
Conclusions
Both compression specific power input and power input increase with an increase in the compression ratio values. As the working fluid mass flow rate increases for a fixed compression inlet temperature, the compression power input requirements increase too.
References
JANAF Thermochemical Data - Tables, 1970
Stoichiometric Combustion (Carbon, Hydrogen, Sulfur, Coal, Oil and Gas)
Introduction
This section provides a combustion analysis for a few typical fuel cases (carbon, hydrogen, sulfur, coal, oil and gas) when the fuel reacts with air at stoichiometric conditions.
Analysis
In the presented combustion analysis, both fuel and air are at standard inlet combustion conditions of 298 [K] and 1 [atm] of absolute pressure. Furthermore, combustion is complete and with no heat loss.
During combustion, a large amount of reactants' chemical energy gets released in the form of thermal energy.
Fuel higher heating value (HHV) or heat of combustion is the difference between the reactants enthalpy value and the combustion products enthalpy value per unit mass amount of fuel at the standard reference temperature, which is 298 [K].
When the reactants specific enthalpy value is equal to the combustion products specific enthalpy value, one can calculate the combustion products flame temperature or adiabatic temperature.
Figure 1 presents how the reactants and combustion products specific enthalpy values change with an increase in the temperature.
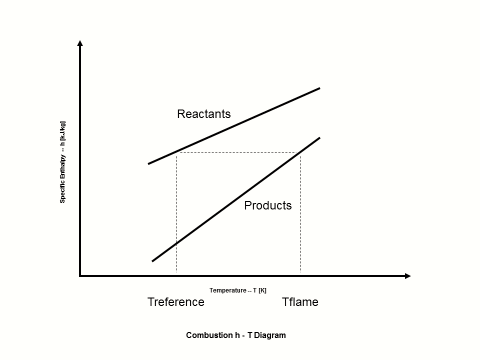
Figure 1 - Reactants and Combustion Products Specific Enthalpy vs Temperature
Physical properties for both reactants and combustion products are very important and need to be known in order to carry out successful combustion calculations.
Figure 2 presents how the reactants and combustion products species specific enthalpy values change with the temperature. The physical properties provided in Figure 2 come from the JANAF Thermochemical Data - Tables, 1970.
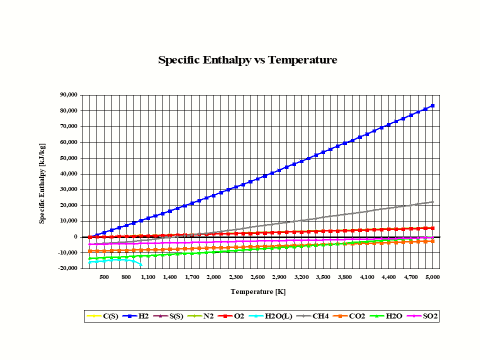
Figure 2 - Reactants and Combustion Products Species Specific Enthalpy vs Temperature
It is interesting to note that the specific enthalpy value for basic combustion elements such as carbon (C), hydrogen (H2), sulfur (S), oxygen (O2) and nitrogen (N2) is equal to zero at the standard combustion conditions of 298 [K] and 1 [atm].
Also, it should be mentioned that for ideal gas species, the specific enthalpy values are only dependent on the temperature.
In addition to knowing the reactants and combustion products physical properties, for any kind of combustion analysis and calculations, it is important to know both oxidant and fuel compositions.
Oxidant composition is usually given on the mole/volume basis. For solid and liquid type fuels, the fuel composition is given on the weight basis for a unit mass amount. For the gas type fuels, the fuel composition is provided on the mole/volume basis for a unit volume amount. In this analysis, methane (CH4) is considered as the gas fuel. In order to keep the combustion analysis simple and straightforward, the CH4 composition is provided on the weight basis.
Table 1 provides the standard air composition.
Table 1 - Oxidant Composition
Oxidant
Air
N
[kg/kg]
0.767
O
[kg/kg]
0.233
N
[kmol/kmol]
0.790
O
[kmol/kmol]
0.210
Table 2 provides the fuel composition.
Table 2 - Fuel Composition
Fuel
Carbon
Hydrogen
Sulfur
Coal
Oil
Gas
C
[kg/kg]
1.000
0.000
0.000
0.780
0.860
-
H
[kg/kg]
0.000
1.000
0.000
0.050
0.140
-
S
[kg/kg]
0.000
0.000
1.000
0.030
0.000
-
N
[kg/kg]
0.000
0.000
0.000
0.040
0.000
-
O
[kg/kg]
0.000
0.000
0.000
0.080
0.000
-
H2O
[kg/kg]
0.000
0.000
0.000
0.020
0.000
-
CH4
[kg/kg]
-
-
-
-
-
1.000
Again, in this combustion analysis, only the stoichiometric combustion is analyzed. Results of such analysis are provided, including combustion products composition on the weight and mole/volume basis, flame temperature, stoichiometric oxidant to fuel ratio and fuel higher heating value (HHV).
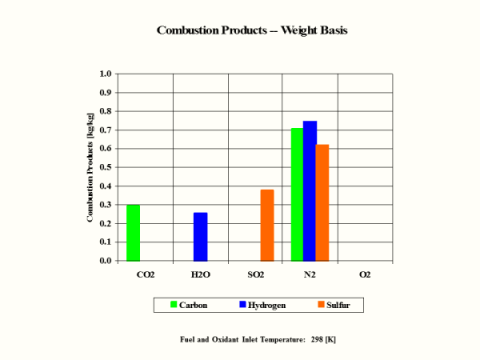
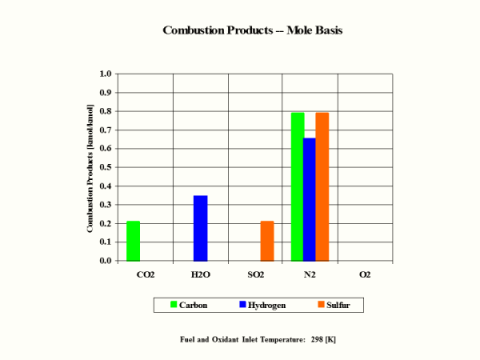
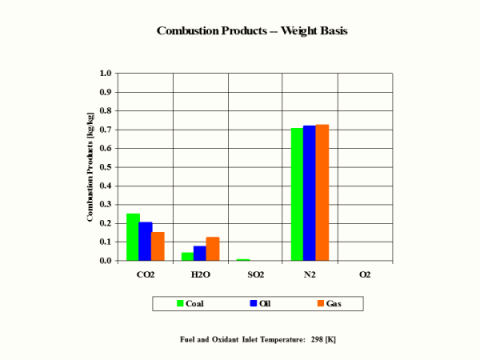
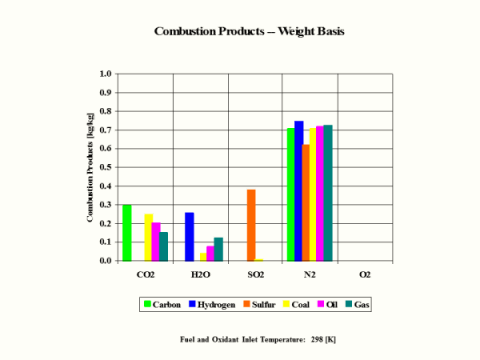
Table 3 provides the combustion products composition on the weight basis.
Table 3 - Combustion Products Composition on the Weight Basis
Fuel
Carbon
Hydrogen
Sulfur
Coal
Oil
Gas
CO2
[kg/kg]
0.295
0.000
0.000
0.249
0.202
0.151
H2O
[kg/kg]
0.000
0.255
0.000
0.041
0.080
0.124
SO2
[kg/kg]
0.000
0.000
0.378
0.005
0.000
0.000
N2
[kg/kg]
0.705
0.745
0.622
0.705
0.718
0.725
O2
[kg/kg]
0.000
0.000
0.000
0.080
0.000
0.000
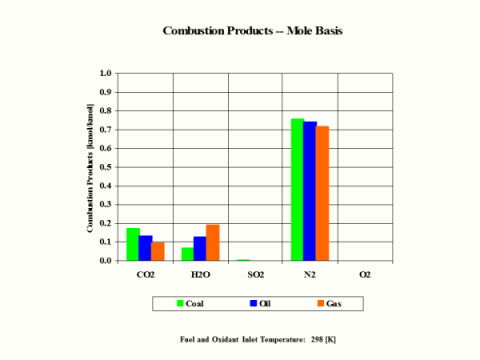
Table 4 provides the combustion products composition on the volume basis.
Table 4 - Combustion Products Composition on the Volume Basis
Fuel
Carbon
Hydrogen
Sulfur
Coal
Oil
Gas
CO2
[kmol/kmol]
0.210
0.000
0.000
0.170
0.132
0.095
H2O
[kmol/kmol]
0.000
0.347
0.000
0.068
0.129
0.190
SO2
[kmol/kmol]
0.000
0.000
0.210
0.002
0.000
0.000
N2
[kmol/kmol]
0.790
0.653
0.790
0.759
0.739
0.715
O2
[kmol/kmol]
0.000
0.000
0.000
0.080
0.000
0.000
When considering coal, oil and gas as the fuel, coal has the largest amount of CO2 in the combustion products on both weight and mole basis.
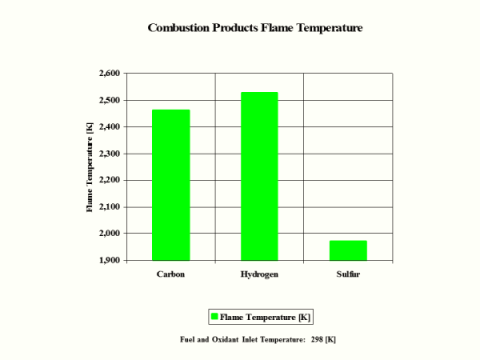
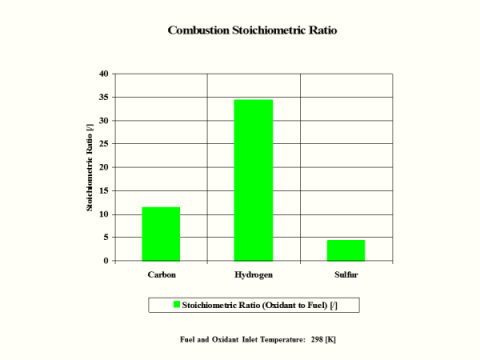
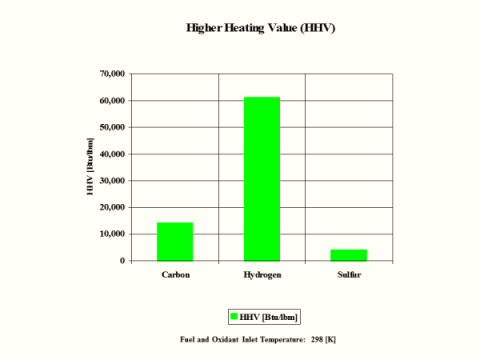
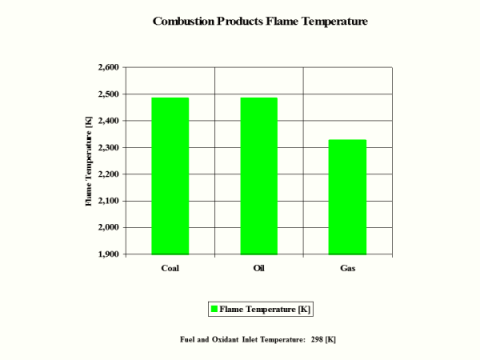
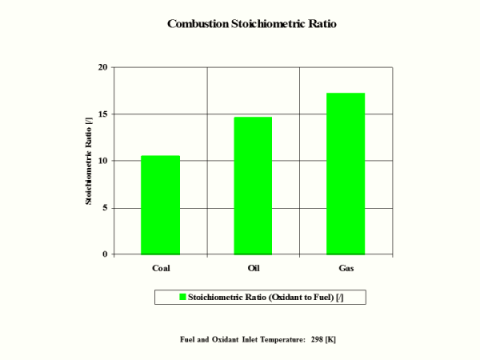
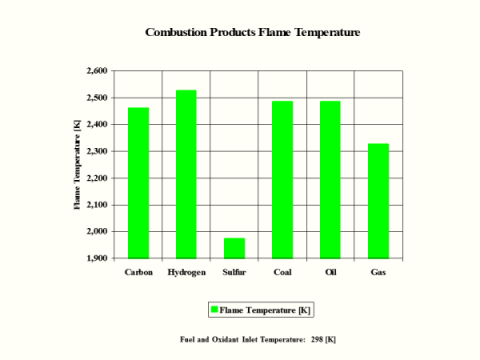
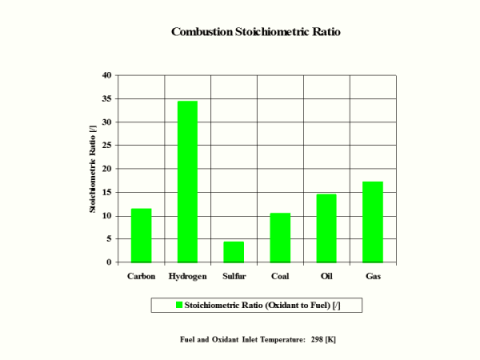
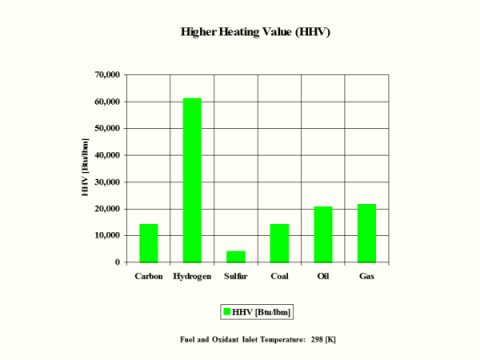
Table 5 provides the combustion products flame temperature, stoichiometric oxidant to fuel ratio and fuel higher heating value.
Table 5 - Combustion Products Flame Temperature, Stoichiometric Oxidant to Fuel Ratio
and Fuel Higher Heating Value
Fuel
Carbon
Hydrogen
Sulfur
Coal
Oil
Gas
Flame
Temperature
[K]
2,460
2,525
1,972
2,484
2,484
2,327
Stoichiometric
Oxidant to Fuel
Ratio
[/]
11.444
34.333
4.292
10.487
14.696
17.167
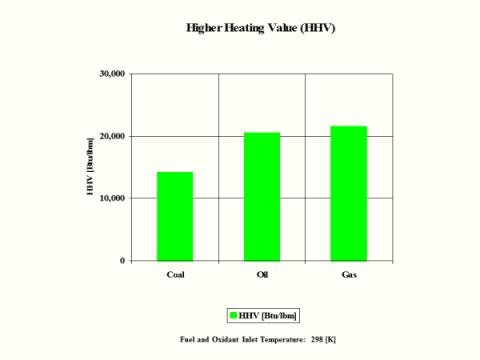
HHV
[Btu/lbm]
14,094
60,997
3,982
14,162
20,660
21,563
Stoichiometric oxidant to fuel ratio is the mass of air required for complete combustion of a unit mass of fuel. Thus, 1 [kg] of carbon fuel requires 11.444 [kg] of air for complete, ideal combustion.
Today, global warming is becoming more evident and it is being said that it is primarily caused by CO2 emissions. A detailed combustion analysis, as it is provided here, can be very useful in determining different fuel and technology scenarios that would result in the reduction of current CO2 emissions.
Assumptions
Species Molecular Weight
Species
Molecular Weight
[kg/kmol]
C
12
H2
2
S
32
O2
32
N2
28
CO2
44
H2O
18
S2O
64
CH4
16
Stoichiometric Oxidant and Combustion Products
Mole Flow Rates for 1 [kmol] of Fuel Species
Fuel
Carbon
Hydrogen
Sulfur
Coal
Oil
Gas
Fuel
Composition
Oxidant
Composition
C
[kmol]
1
0
0
1
1
0
H2
[kmol]
0
1
0
1
1
0
S
[kmol]
0
0
1
1
0
0
CH4
[kmol]
0
0
0
0
0
1
O2
[kmol]
1
0.5
1
2.5
1.5
2
N2
[kmol]
3.762
1.881
3.762
9.404
5.642
7.524
CO2
[kmol]
1
0
0
1
1
1
Combustion Products
Composition
H2O
[kmol]
0
1
0
1
1
2
SO2
[kmol]
0
0
1
1
0
0
O2
[kmol]
0
0
0
0
0
0
N2
[kmol]
3.762
1.881
3.762
9.404
5.642
7.524
Stoichiometric Oxidant to Fuel Ratio, Oxidant and Combustion Products
Mass Flow Rates for 1 [kmol] of Fuel Species
Fuel
Carbon
Hydrogen
Sulfur
Coal
Oil
Gas
Fuel
Composition
Oxidant
Composition
C
[kg]
12
0
0
12
12
0
H2
[kg]
0
2
0
2
2
0
S
[kg]
0
0
32
32
0
0
CH4
[kg]
0
0
0
0
0
16
O2
[kg]
32
16
32
80
48
64
N2
[kg]
105.336
52.668
105.336
263.312
157.976
210.672
CO2
[kg]
44
0
0
44
44
44
Combustion Products
Composition
H2O
[kg]
0
18
0
18
18
36
SO2
[kg]
0
0
64
64
0
0
O2
[kg]
0
0
0
0
0
0
N2
[kg]
105.336
52.668
105.336
263.312
157.976
210.672
Stoichimetric
Oxidant to Fuel
Ratio
[/]
11.444
34.333
4.292
7.463
14.712
17.167
Both fuel and air are at standard inlet combustion conditions of 298 [K] and 1 [atm] of absolute pressure.
Furthermore, combustion is complete and with no heat loss.
Governing Equations
Fuel higher heating value (HHV) or heat of combustion is the difference between the reactants enthalpy value and the combustion products enthalpy value per unit mass amount of fuel at the standard reference temperature, which is 298 [K].
When the reactants specific enthalpy value is equal to the combustion products specific enthalpy value, one can calculate the combustion products flame temperature or adiabatic temperature.
Input Data
Table 1 - Oxidant Composition
Oxidant
Air
N
[kg/kg]
0.767
O
[kg/kg]
0.233
N
[kmol/kmol]
0.790
O
[kmol/kmol]
0.210
Table 2 - Fuel Composition
Fuel
Carbon
Hydrogen
Sulfur
Coal
Oil
Gas
C
[kg/kg]
1.000
0.000
0.000
0.780
0.860
-
H
[kg/kg]
0.000
1.000
0.000
0.050
0.140
-
S
[kg/kg]
0.000
0.000
1.000
0.030
0.000
-
N
[kg/kg]
0.000
0.000
0.000
0.040
0.000
-
O
[kg/kg]
0.000
0.000
0.000
0.080
0.000
-
H2O
[kg/kg]
0.000
0.000
0.000
0.020
0.000
-
CH4
[kg/kg]
-
-
-
-
-
1.000
Results
Table 3 - Combustion Products Composition on the Weight Basis
Fuel
Carbon
Hydrogen
Sulfur
Coal
Oil
Gas
CO2
[kg/kg]
0.295
0.000
0.000
0.249
0.202
0.151
H2O
[kg/kg]
0.000
0.255
0.000
0.041
0.080
0.124
SO2
[kg/kg]
0.000
0.000
0.378
0.005
0.000
0.000
N2
[kg/kg]
0.705
0.745
0.622
0.705
0.718
0.725
O2
[kg/kg]
0.000
0.000
0.000
0.080
0.000
0.000
Table 4 - Combustion Products Composition on the Volume Basis
Fuel
Carbon
Hydrogen
Sulfur
Coal
Oil
Gas
CO2
[kmol/kmol]
0.210
0.000
0.000
0.170
0.132
0.095
H2O
[kmol/kmol]
0.000
0.347
0.000
0.068
0.129
0.190
SO2
[kmol/kmol]
0.000
0.000
0.210
0.002
0.000
0.000
N2
[kmol/kmol]
0.790
0.653
0.790
0.759
0.739
0.715
O2
[kmol/kmol]
0.000
0.000
0.000
0.080
0.000
0.000
Table 5 - Combustion Products Flame Temperature, Stoichiometric Oxidant to Fuel Ratio
and Fuel Higher Heating Value
Fuel
Carbon
Hydrogen
Sulfur
Coal
Oil
Gas
Flame
Temperature
[K]
2,460
2,525
1,972
2,484
2,484
2,327
Stoichiometric
Oxidant to Fuel
Ratio
[/]
11.444
34.333
4.292
10.487
14.649
17.167
HHV
[Btu/lbm]
14,094
60,997
3,982
14,162
20,660
21,563
Figures
Conclusions
Hydrogen as the fuel has the highest flame temperature, requires the most mass amount of oxidant/air in order to have complete combustion per unit mass amount of fuel and the largest fuel higher heating value.
When hydrogen reacts with oxidant/air, there is no CO2 present in the combustion products.
References
JANAF Thermochemical Data - Tables, 1970
Expansion
Introduction
This section provides an isentropic expansion analysis when the working fluid is air.
Analysis
In the presented expansion analysis, only air is considered as the working fluid behaving as a perfect gas -- specific heat has a constant value. Ideal gas state equation is valid -- pv = RT.
Air enters a turbine at point 1 and it exits the turbine at point 2. Isentropic expansion is considered with no entropy change.
Figure 1 presents an expansion schematic layout.
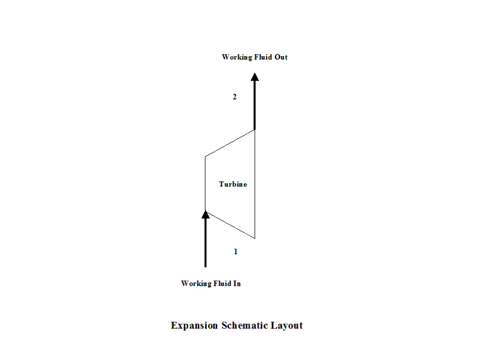
Figure 1 - Expansion Schematic Layout
Figure 2 presents an expansion temperature vs entropy diagram.
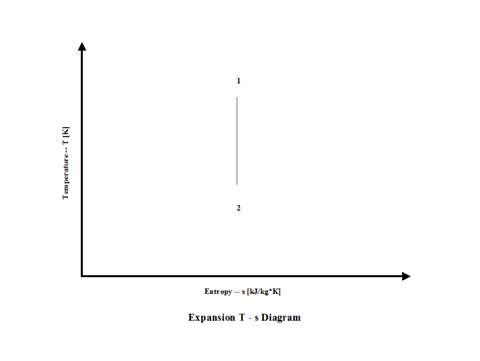
Figure 2 - Expansion Temperature vs Entropy Diagram
Figure 3 presents expansion specific power output values for a few typical expansion ratio values. It should be noted that the air enters the turbine at the temperature of 1,500 [K] and the turbine exhaust pressure is always equal to the standard ambient pressure -- 1 [atm] of absolute pressure.
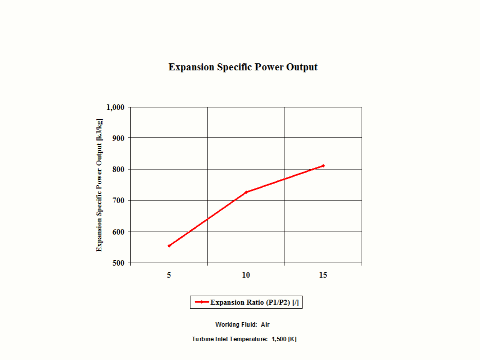
Figure 3 - Expansion Specific Power Output
Figure 4 presents expansion power output values for two typical expansion ratio values and a few different working fluid mass flow rate values for a fixed expansion inlet temperature.
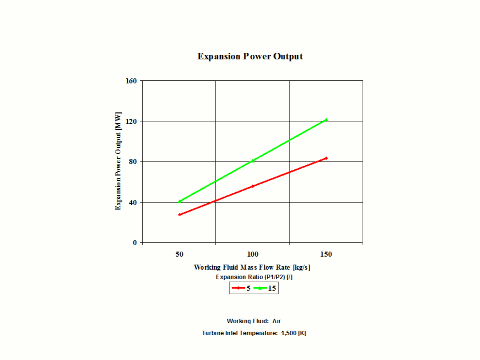
Figure 4 - Expansion Power Output
One can notice that both expansion specific power output and power output increase with an increase in the expansion ratio values. As the working fluid mass flow rate increases for a fixed expansion inlet temperature, the expansion power output values increase too.
Assumptions
Working fluid is air. There is no friction and heat transfer. Expansion is isentropic -- there is no entropy change. Ideal gas state equation is valid -- pv = RT. Air behaves as a perfect gas -- specific heat has a constant value.
Governing Equations
T1/T2 = (p1/p2)^(ϰ-1)/ϰ
ϰ = cp/cv
cp - cv = R
pv = RT
w = cp(T1 - T2)
W = cp(T1 - T2)m
Input Data
T1 = 1,500 [K]
p1 = 5, 10 and 15 [atm]
p2 = 1 [atm]
R = 0.2867 [kJ/kg*K]
cp = 1.004 [kJ/kg*K]
ϰ = 1.4 [/]
m = 50, 100 and 150 [kg/s]
Results
Specific Power Output vs Expansion Ratio
Expansion Inlet Temperature = 1,500 [K]
Compression
Ratio
[/]
5
10
15
Specific Power
Input
[kW/kg/s]
174
278
349
Power Output vs Expansion Ratio for a few Mass Flow Rates
Expansion Inlet Temperature = 1,500 [K]
Power Output
[MW]
Compression Ratio
[/]
5
15
Mass Flow Rate
[kg/s]
50
27.8
40.6
100
55.5
81.1
150
83.3
121.7
Conclusions
Both expansion specific power output and power output increase with an increase in the expansion ratio values. As the working fluid mass flow rate increases for a fixed expansion inlet temperature, the expansion power output values increase too.
References
JANAF Thermochemical Data - Tables, 1970